Thursday, 19 January 2017

USD/CAD ...

Hello Again, 

Here is One More today ... 

Currency Pair : USD/CAD 


After a Fake break below rising channel,The Pair again re-entered the channel and Moving up now. Crossed important resistance also, Buy on all Declines will be a good trade with Low Risk, High Reward. 

Recommendation : 

USD/CAD 
Buy Limit : 1.3260
Stoploss : 1.3180
Take Profit : 1.3580

Below 1.3180 .... Don't Remain Long, Sell for Big Targets.

Risk : 80 pips
Reward : 320 pips 
The Risk Reward is amazing 1:4 and The Trade looks attractive at this point.

Consult your Financial Adviser before entering the trade and follow Strict Risk Management. Consider Your Account size and Risk before entering the trade. 

The Adviser is a Technical Analyst and Global Market Expert with 8+ years expertise in advisory service for clients all over the world.


GBP/JPY ... GOOD OPPORTUNITY !!

Hello Friends, 

Back Again with a Good Opportunity, 

Currency Pair : GBP/JPY 

The Pair is Volatile and Moves Big, Now Most of the News seems to be done and the Pair is Expected to Move on it's own.. 


This is a Daily Chart showing the Pair has done breakout on a Longer term and Now completed the retesting of the breakout trendline. Ready for the Next upmove, The Pair is currently trading above 23.6 retracement of the recent fall from 195 to 123 levels. The retracement is expected to continue till 38.2 extension level at around 151. a Minor Resistance at around 142.45 level will be small hurdle in the way.   


The Pair as we have seen in the previous chart is expected to move higher, while reaching our short term target the pair will form a Chart Pattern "Inverted Head & Shoulder". The Pattern is One of the most successful Patterns, if the Neckline which again will be around 151 level in near term is crossed, We might see a Big upside in Near Future. 

The Stoploss for all Longs will be around recent low of 137, The Risk Reward in this case is amazingly good, Nearly 400 pips Stoploss and target of around 1000+ pips. The Pair may take time to complete the projected move, but it will be a Huge Gain !! 

Recommendation :

GBP/JPY
Buy Limit : 141 and if dips till 139
Stoploss : 138
Take Profit : 142.40 - 145.20 - 148 - 151.60 

Risk : 300-350 pips
Reward : 1000 pips approx 
Risk : Reward of 1:3 is good for taking a Trade. 

Please, Consult your Financial Adviser and Follow Strict Risk Management, Consider your account size and risk before entering the trades. 

The Adviser is a Technical Analyst and Global Market Expert.

Tuesday, 10 January 2017

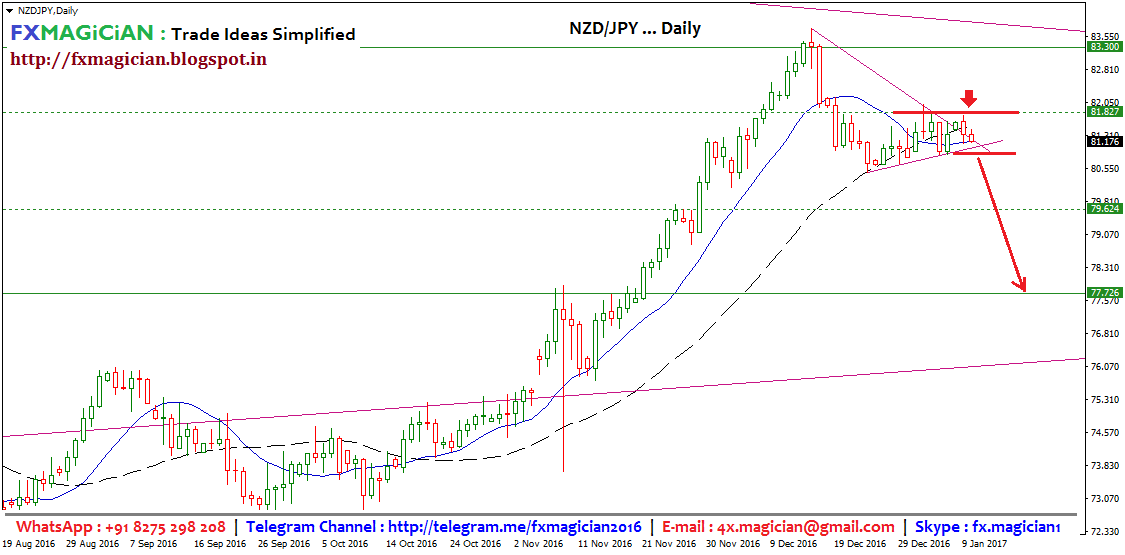
NZD/JPY.... Good Opportunity !!

Hello Guys, 

Posting on Blog after a Long time. 

Today's Post will be : NZD/JPY 

Let's Go to Charts .. 

Monthly Chart First 


Monthly Chart Shows a Stiff Resistance of falling Trendline, and a Sharp Pin Bar Formation near Trendline in Last Months Candle. Clear Indication of weakness in the pair. 

Trendline Resistance is close to current price and Lower Trendline Support is at a Good Distance, Providing us a Good Risk Reward for the Trade.

If the Support is broken, we might see lower levels and a continued weakness. Targets might be much lower, but we will review near that level. Not Suggesting any speculative targets as of now. We will play between the trendlines only. 

Moving Average Crossovers are suggesting weakness, Price is trading below the 50SMA, indicating weakness. 

Moving Ahead, Let's See Weekly Chart : 

  
The Weekly Chart Supports Downside possibilities. Again a Pin Bar is Visible near the Trendline on Weekly Chart also. We might see some upside to support higher selling entry with a smaller Stoploss and a Bigger Target for the pair. The Moving Average Crossover is expected to turn bearish soon. 

Daily Chart : 

Clear Bearish Chart, Short Term Trendline Resistance is sustained and price is not able to cross the Resistance. On Top Price is Getting Resistance at same level since last few days. There is a Support of Smaller trendline and We will get a strong Sell Below that Support. Moving Average Crossover suggesting start of the weakness and bear trend in the pair. 

Remember, we have applied different Moving Average Combination on every chart according to our study. Entry and Exit levels are Indicative levels, Manage Your Entries and Trades according to Market Conditions. 

Follow Strict Risk Management and Do not Over trade. 

The Recommendation : 

NZD/JPY 
 
Sell Limit : 81.40 & 82.40

Stoploss : 83.40 

Take Profit : 79.60 - 77.80 (We will review Below 77.80) 


Trade according to your Risk Management, Trade Might Take Longer Duration to complete targets, so keep Smaller Trades.

All the Best !!


For More Trades, Join Our Paid Services. We Trade Less but generate more big profits slowly and steadily. 

Our "Special Pack" is doing wonders and Our Clients are Enjoying with the results. The Special Pack is for Bigger accounts Only, For small Traders other packages are also available.

Wednesday, 19 October 2016

We are On Telegram Now !!


For the Convenience of All ... Easy to Join and Easy to Follow ... 

No Need to disclose your identity while following our Free Signals and updates, Just Join the Channels and Enjoy Trading !! 

We Will not Add any WhatsApp Request for Free Signals and Updates. 

Please Follow the following links 

Free Index Signals : 
Find @globalindices and Join the Channel 


Free Forex Signals : 
Find @fxmagician2016 and Join the Channel

When a channel opens, Just click on Join and get in to enjoy !! 


AUD/USD ... Breaking Out ??

Hello Friends, 

Coming to the Point, Today We will Look at AUD/USD. 

Let's have a Weekly Chart First


Let's Have a Look at this Chart, Simple and Sweet Chart shows The Pair is Breaking out of the Long Term Falling Trend. The Pair was in Bearish Trend since Last 6 years and The Fall was assisted by a Long Term Falling Trendline providing stiff resistance whenever the pair tried to rise. at Current Situation, the Pair has pierced the Trendline resistance and trading up above the trendline. Problem is, we don't have a full candle closing above the Falling Trendline. 

We will Need a Candle Closing above the Trendline in Weekly Chart, But for this we are having some support from the Short Term Rising Channel as shown in the above chart at the bottom area. The Price is moving in a Rising Channel since last few Months and the pair witnessed support along the channel support and moving up. 

We may find some more developments in support of the upside. Let's go to Daily Chart


This is a Line Chart on Daily timeframe, We may see a clear development of a Chart Pattern "Inverted Head and Shoulder" The Pattern is highly reliable and works out excellent if Found Near Lows and after a big Long bearish trend. We can assume a Trend Reversal with this formation. 
In this case the Inverted Head and Shoulder Pattern is showing a price movement of 1000 pips above the Neckline and above the falling trendline as both are very close in this area and forming a confluence point, giving strong Resistance for the price to Push Further up. Once the pair clear the Resistance zone around 0.7670-0.7700, we will see a Fresh Bullish Momentum in this pair and a price Target of 1000 pips can be easily achieved. It may not be Possible in One Single move, It will take time and some time bound corrections to reach the targets. 

We Expect The Pair will Take Good support around 0.7520 area which is a Support on the Short term rising channel and a Support line. The support is hardly 120 pips away and the upside is approx 1000 pips, which is a Great Risk Reward Ratio to enter the trade, but we advice to follow strict Risk Management and Consult your personal Trading Adviser for further guidance. If you do not follow any Investment Adviser or Trading adviser, Do not Risk your money !! 

Our Recommendation in this Pair 

BUY AUD/USD around 0.7680 with a Stoploss around 0.7520 and Take Profits around 0.7840 - 0.8020 - 0.8270 - 0.8580 

Disclaimer :
The Author is a Certified Investment Adviser and Global Market Expert, He is having an experience of 8 years in Global Markets. 

For Paid Subscriptions and Advisory Contact the Author on 
WhatsApp +91 8275 298 208

For Free Services and updates 
Join Telegram Channel :- https://telegram.me/fxmagician2016

Saturday, 15 October 2016

DAX30 (GER30) .... What's in Store ??

Hello Friends, 

Back Again with a Trade Idea and This time it's about a Stock Market Index. 

The German Stock Market Index : DAX30 (GER30) 

Yes, It's One of My Favorite Index, Lovely Index to Trade.

Globally Some Panic is seen in Investors across many major Markets, but is it the truth ?? I Strongly Disagree, May be I am wrong, but I always say what I see on the Charts. No Bias, nothing emotional and No Vested Interest, Plain Trading views only. May be the retail Investors are getting trapped in these kind of moves and the so called Big Analysts are trying to keep the small traders away from Markets for whatever reasons. I don't care about any contra views or opinions, I am just putting up the things what I see, there may always be a difference of opinion in Technical Analysis. Forget it, Let's come to point.. 

We will see Charts One by One, 


This is a Daily Chart, We see a Clear Breakout from the falling trend is already in place and it is confirmed by retesting the falling trendline, both breakout and retesting levels are marked by small thick green arrows. The falling trendline is marked with brown color. 

The Price is moving in a Rising channel from the lows, Marked in Blue. there is also a possibility of a express uptrend channel as marked by lime color. 
Both the channels are Rising channel showing price has entered in uptrend. if the blue channel is followed, we might stop near 11000 levels. if lime color channel is followed we may move higher. in both cases upside is valid. while on downside there are big supports to resist fall. 

Let's see a different view. 


This is same chart with another perspective. After falling from All time high, the index started moving higher but still far away from all time high levels, While reversing to the uptrend, the price movement formed a chart pattern called "CUP and Handle" Pattern. The Handle is about to be completed. The Neckline for this formation is placed around 10820 and the depth of cup is approx 9000 levels, giving a height of 1820 points, Once Price moves above Neckline we may expect the movement of 1820 points on the upside above 10820 levels giving a price target of 12700, After breakout it will be a faster move towards the targets. 

Let's see One More Chart 


The Same chart with a different story, This time we are focusing on a Smaller part of the chart, Here I see a FLAG formation, it's a continuation pattern and is a reliable pattern with a good success rate. Here the Flag hasn't given any breakout yet. The Pole Height in this case is approx 1170 points and once the breakout is done above 10680 levels, We may expect the index to move 1170 points approx, ultimately it will not be a one sided move, it will be Huge Breakout supporting the Cup & Handle Breakout to complete and it will take the price to higher levels and we might see 11850+ levels. 

Overall I am Looking at the Bullish Formations spread on the chart and they are telling a big growth story. yes ofcourse I have the rights to be wrong always. My views and opinions are not valid if the 10680 level is not crossed and sustained. 

My Clients are already long in Indices taking benefit of This weeks fall and we might close the trades in between at any point of time. 

My Recommendation will be : 

BUY DAX30 (GER30) on all dips towards 10400 Keep a Stoploss of 10200 with Take Profit around 10680 -  11000 and Above 

The Trade is showing Excellent Risk Reward. 

Disclaimer : 
The Author is a Global Market Expert and Technical Analyst working in Global Markets as an Investment Adviser and Fund Manager. He is bearing a vast experience of more than 8 years. 

Contact details : 
WhatsApp : +91 8275 298 208 

Free Index Signals : https://telegram.in/globalindices
Free Forex Signals : https://telegram.in/fxmagician2016 

Paid Subscriptions are Available in Indices Trading Signals, Communicate through WhatsApp for more details. 

For Trading platform Visit : Broker